One day I was looking out my window and a question came to mind: if the space on my street was allocated proportionally by numbers to pedestrians, bikes, and cars, would the car lane would be wide enough for any cars to fit through at all? I decided to collect some data to find out.
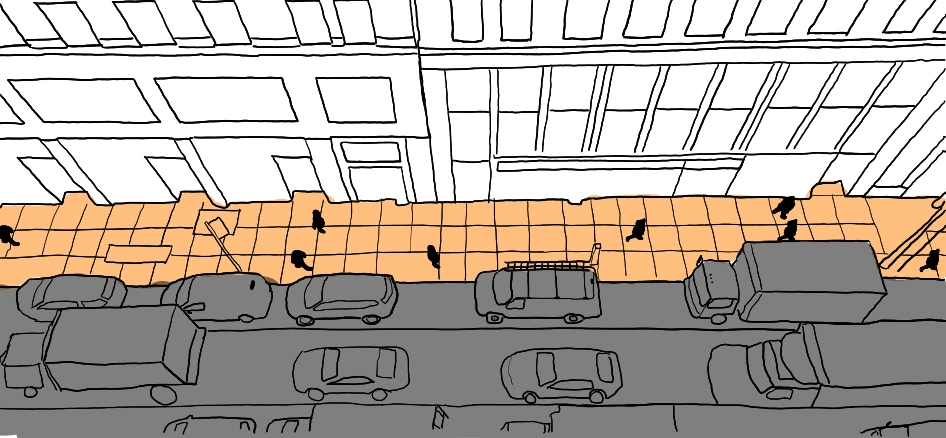
To get an accurate estimate of the numbers of pedestrians, bikes, and cars on my street, I collected data in six one hour time slots at different times of the day and on different days of the week during a few weeks in March. I looked out the window of my apartment and tallied the numbers of cars/trucks, bikes/micromobility, and pedestrians that passed a specific lamppost in my field of view. I counted every car truck or bus that passed the point but did not count parked cars. For bikes, I counted all forms of micromobility passing in both directions (I live on a one way street but there’s enough room for bikes to go both ways). For pedestrians, I counted adults and children who were moving of their own accord but I did not count strollers (maybe I should have), luggage, dogs, carts, or people walking in the street. I also only counted pedestrians on one side of the street because I can only see one side of the street from my window and because it would have been too difficult to count both sides at once.
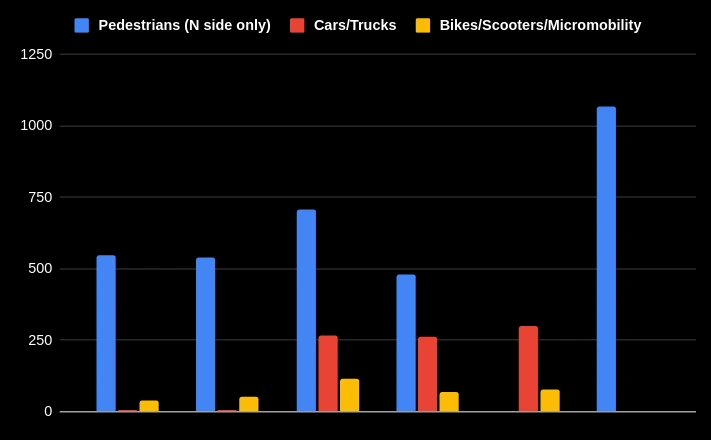
The first two days that I collected data, I had way lower car counts than I expected. I later realized when I walked outside at a similar time that ConEd had closed off the street to cars for an underground maintence project. My other data points were collected on a Wednesday around lunch, on a Sunday evening, and at rush hour. Note that foot traffic was so high at rush hour that I counted cars and bikes on one day then counted pedestrians on the next day at the same time. A graph of my counts is here:
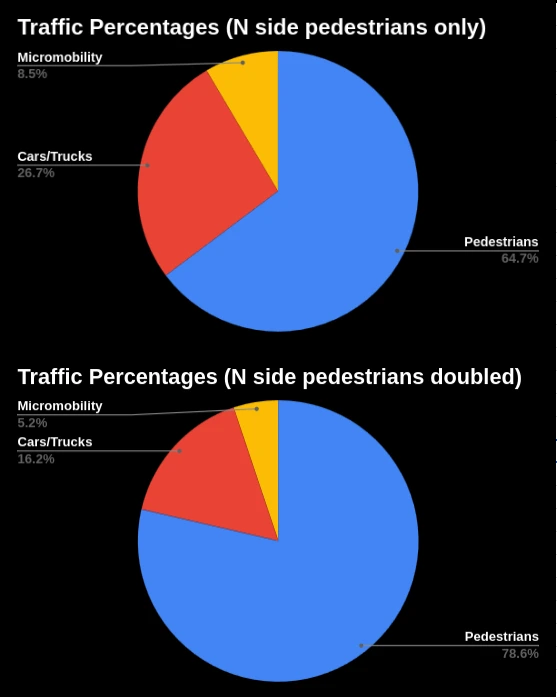
We can also look at the percentages by averaging over the good data (excluding cars/trucks and micromobility counts from the days when the street was closed). Here are the percentages calculated directly from my counts (pedestrians on only one side) and the percentages when we double the pedestrian count (to accout for both sides of the street):
Finally we’re ready to answer my original question: Can the cars fit if we allocate space proportionally? My street is 60 ft wide (source) so the answer is just barely. By this metric pedestrians should get 47.2 ft of sidewalk, cars/trucks should get 9.7 ft, and bikes/micromobility should get 3.1 ft. This division of space might look something like this:
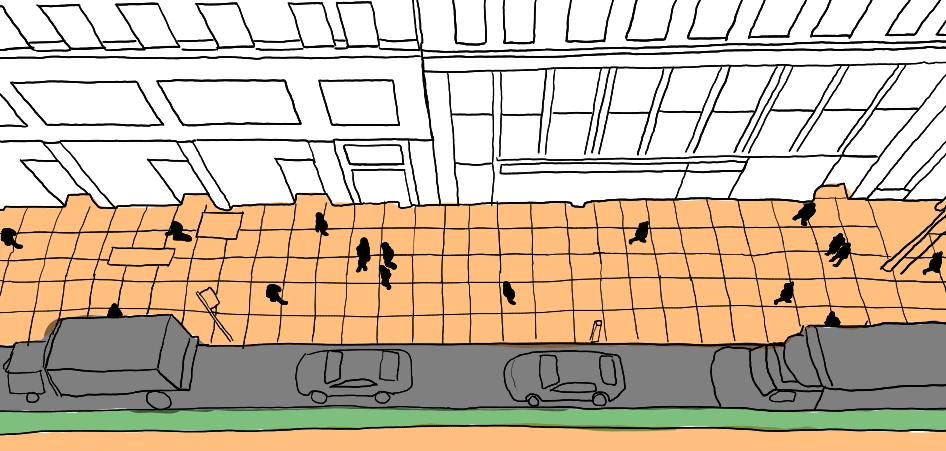
This is obviously an oversimplified view of street use but it does highlight just how much cars are favored over everyone else in our public spaces. My street has a large number of delivery trucks serving office buildings and restaurants and we can’t just elimate their parking/loading zones entirely but we may benefit from reconsidering the space we give to cars.
For the bike counts in this project, we must consider that dedicated bike lanes exist on parallel streets nearby. This could indicate that my bike counts were lower than average for the area and/or that it may not be necessary to have a bike lane on my street at all.
My overall point is that we should reconsider how much public space we give to cars and consider giving more of it back to pedestrians since they are the overwhelming majority of street users in the city.